
Everything you need to keep watch.
Monitor public websites, verify outages, and keep the details together.
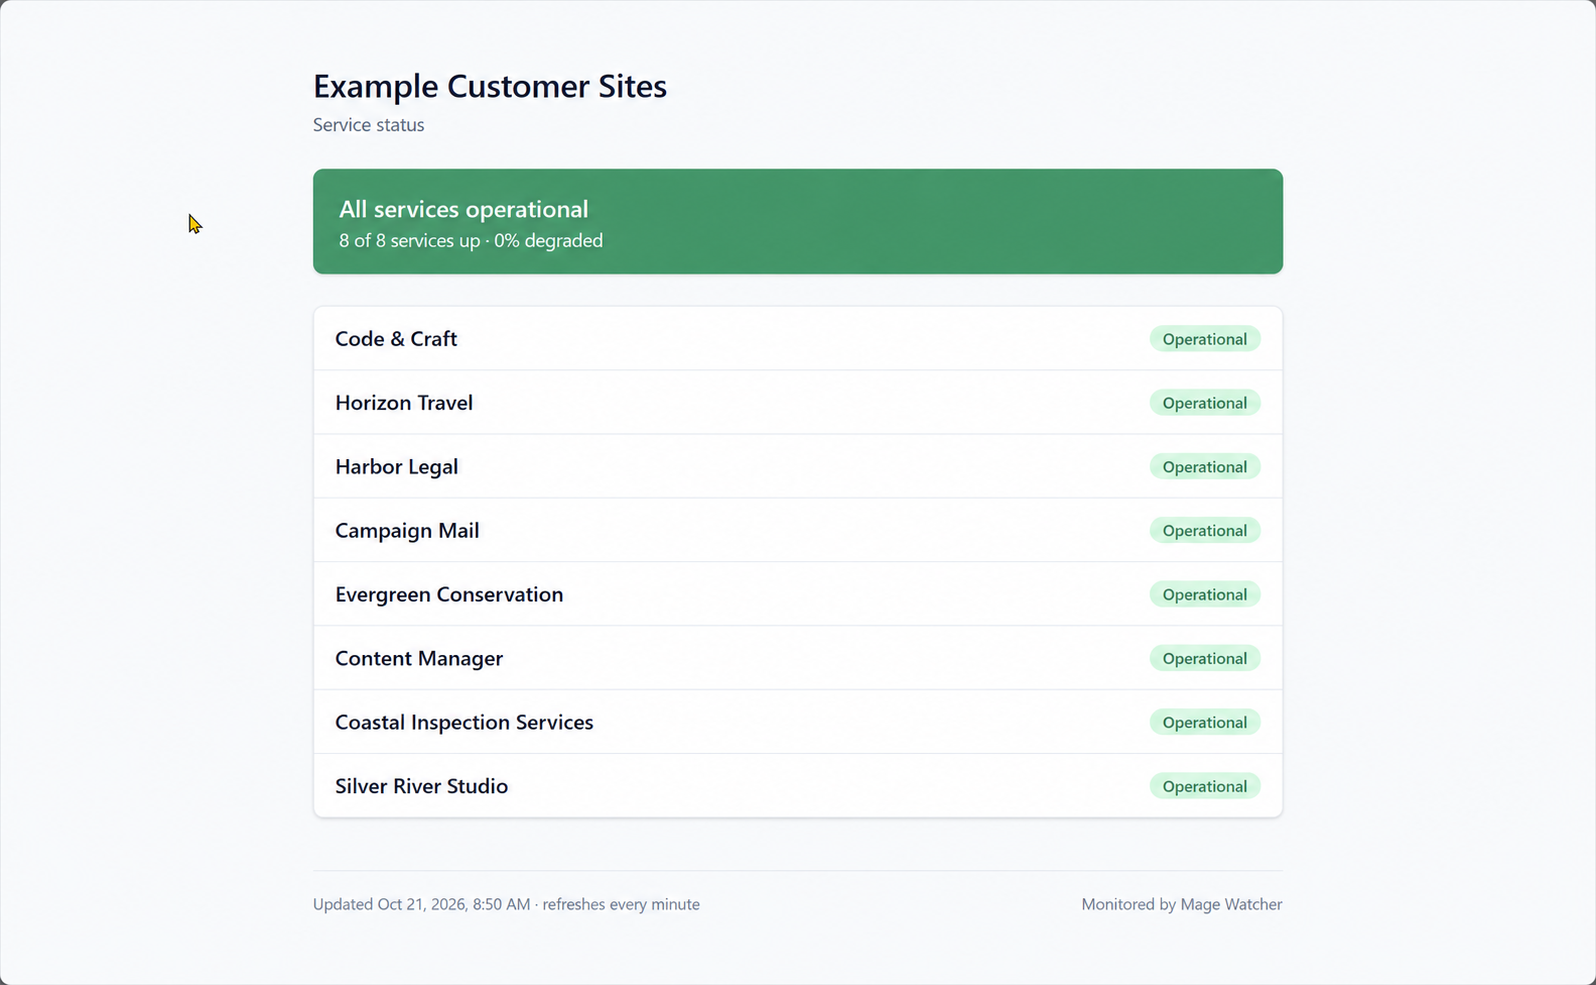
Check availability and the content that matters.
Monitor HTTP and HTTPS pages with GET, HEAD or POST requests. Check as often as every minute, follow redirects, and require a phrase to appear on the page.
Intervals: 1, 5, 10, 15, 30 or 60 minutes. Timeout: 1–60 seconds. Expected final status: 200.
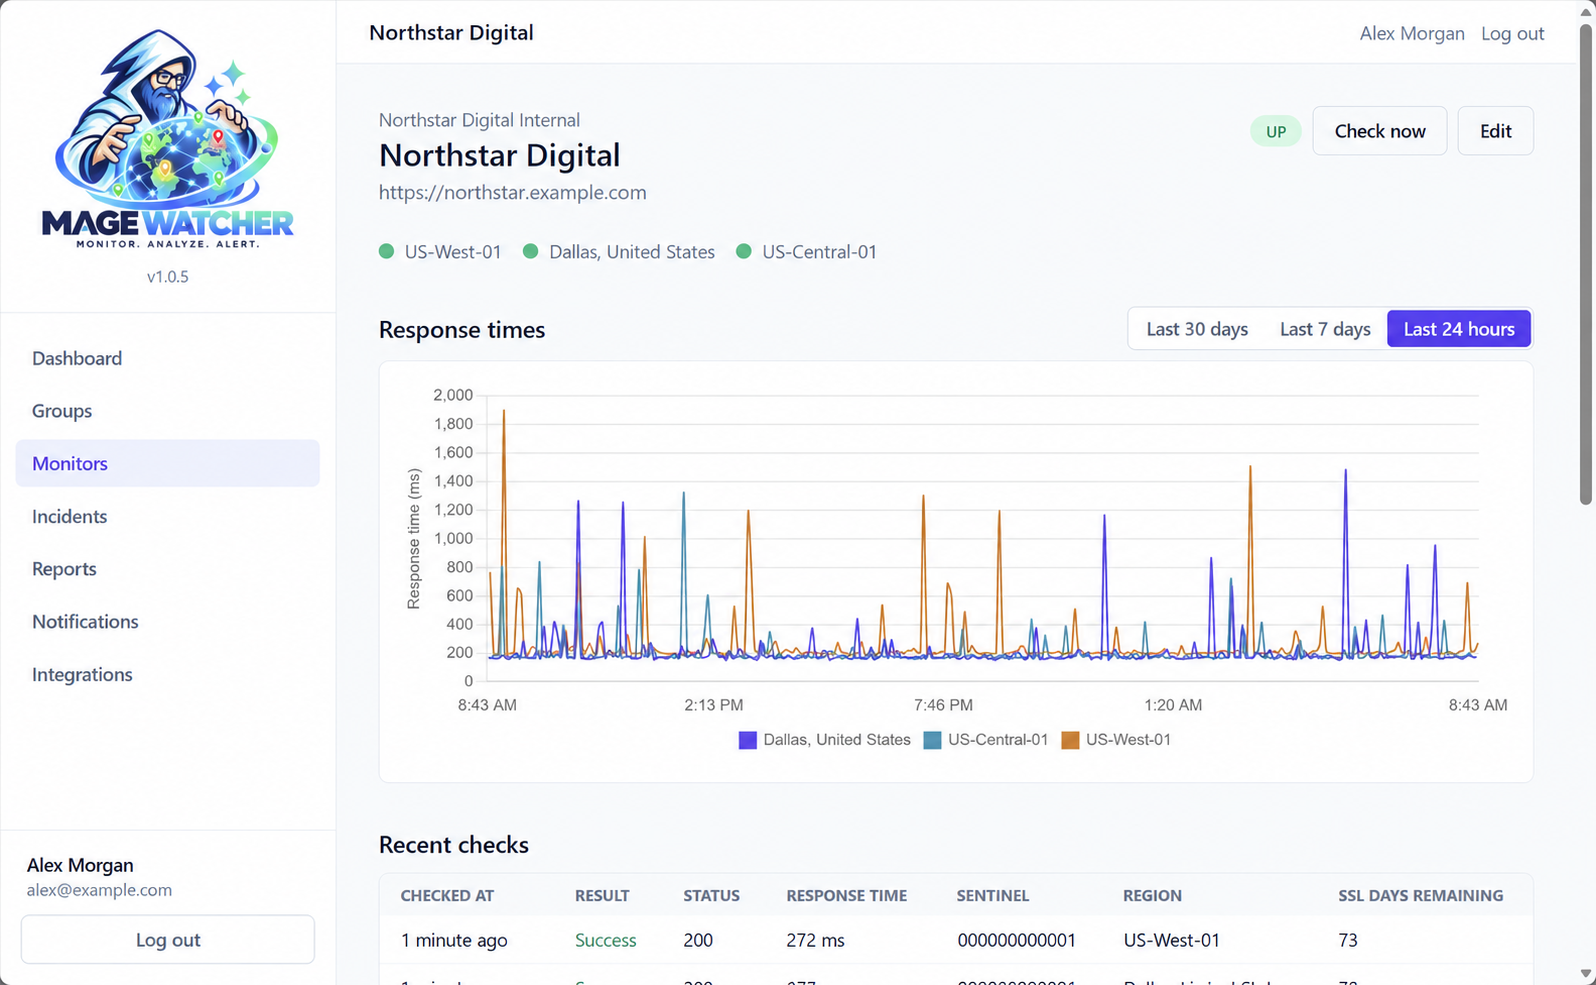
See how fast each region responds.
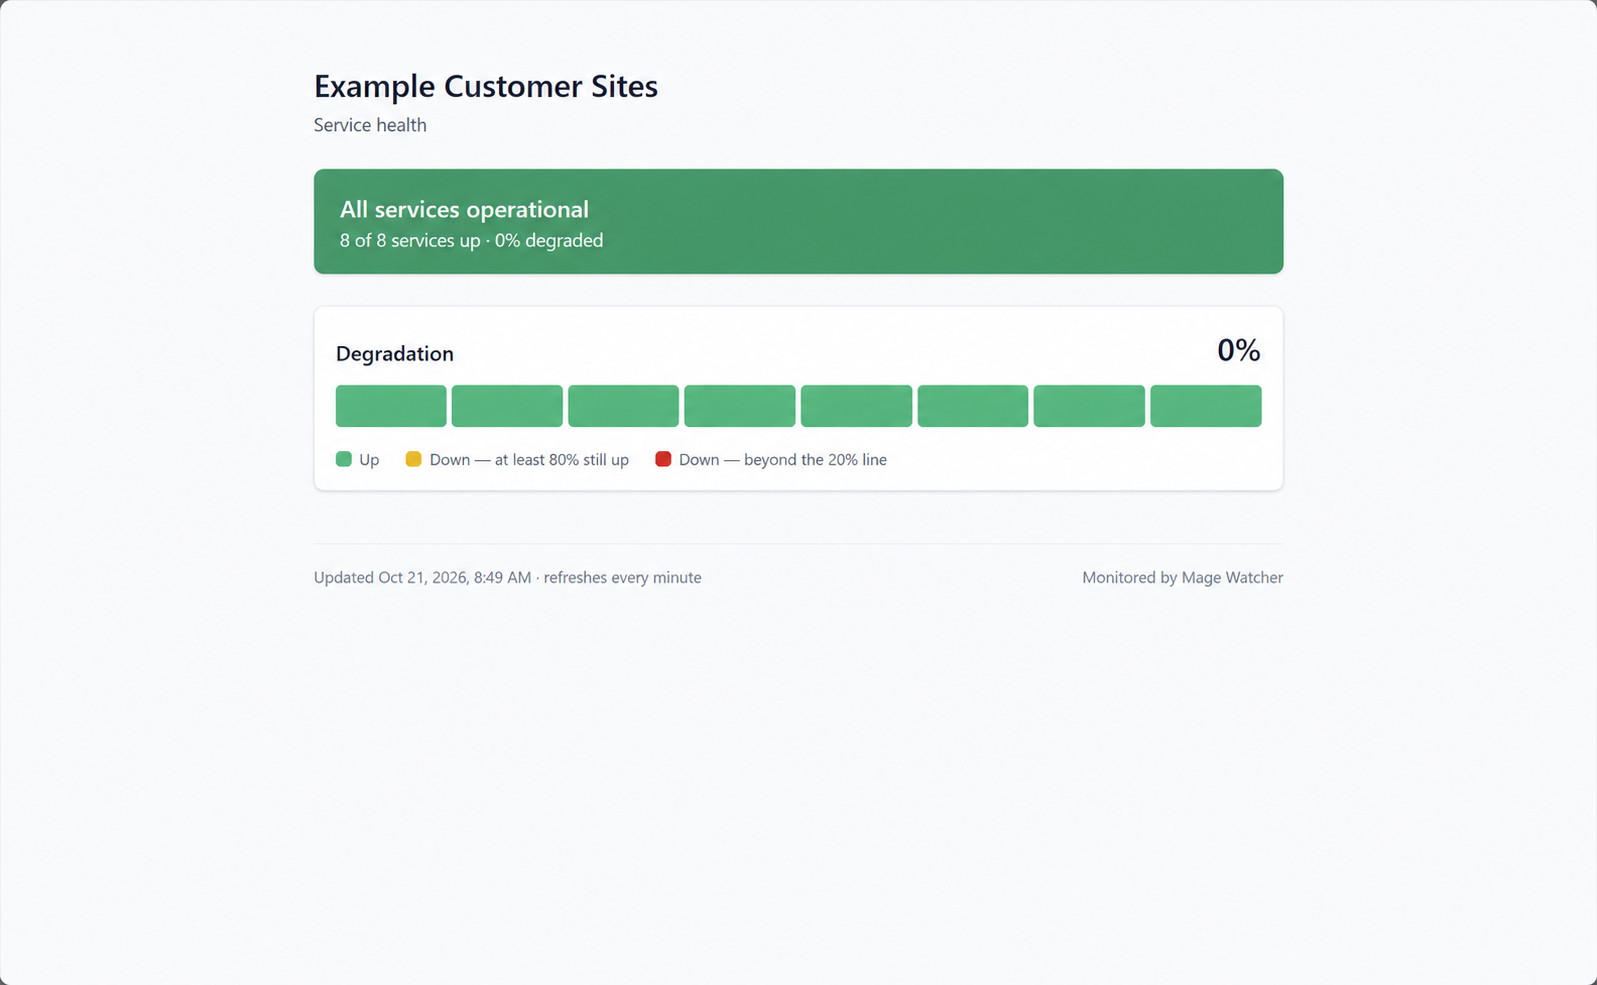
Chart response times from each monitoring region over the last 24 hours, 7 days or 30 days. Recent checks list the result, HTTP status, response time, region and SSL days remaining. A configured response-time threshold marks a site as degraded on the dashboard.
Slowness alone does not trigger an email alert.
Confirm before you notify.
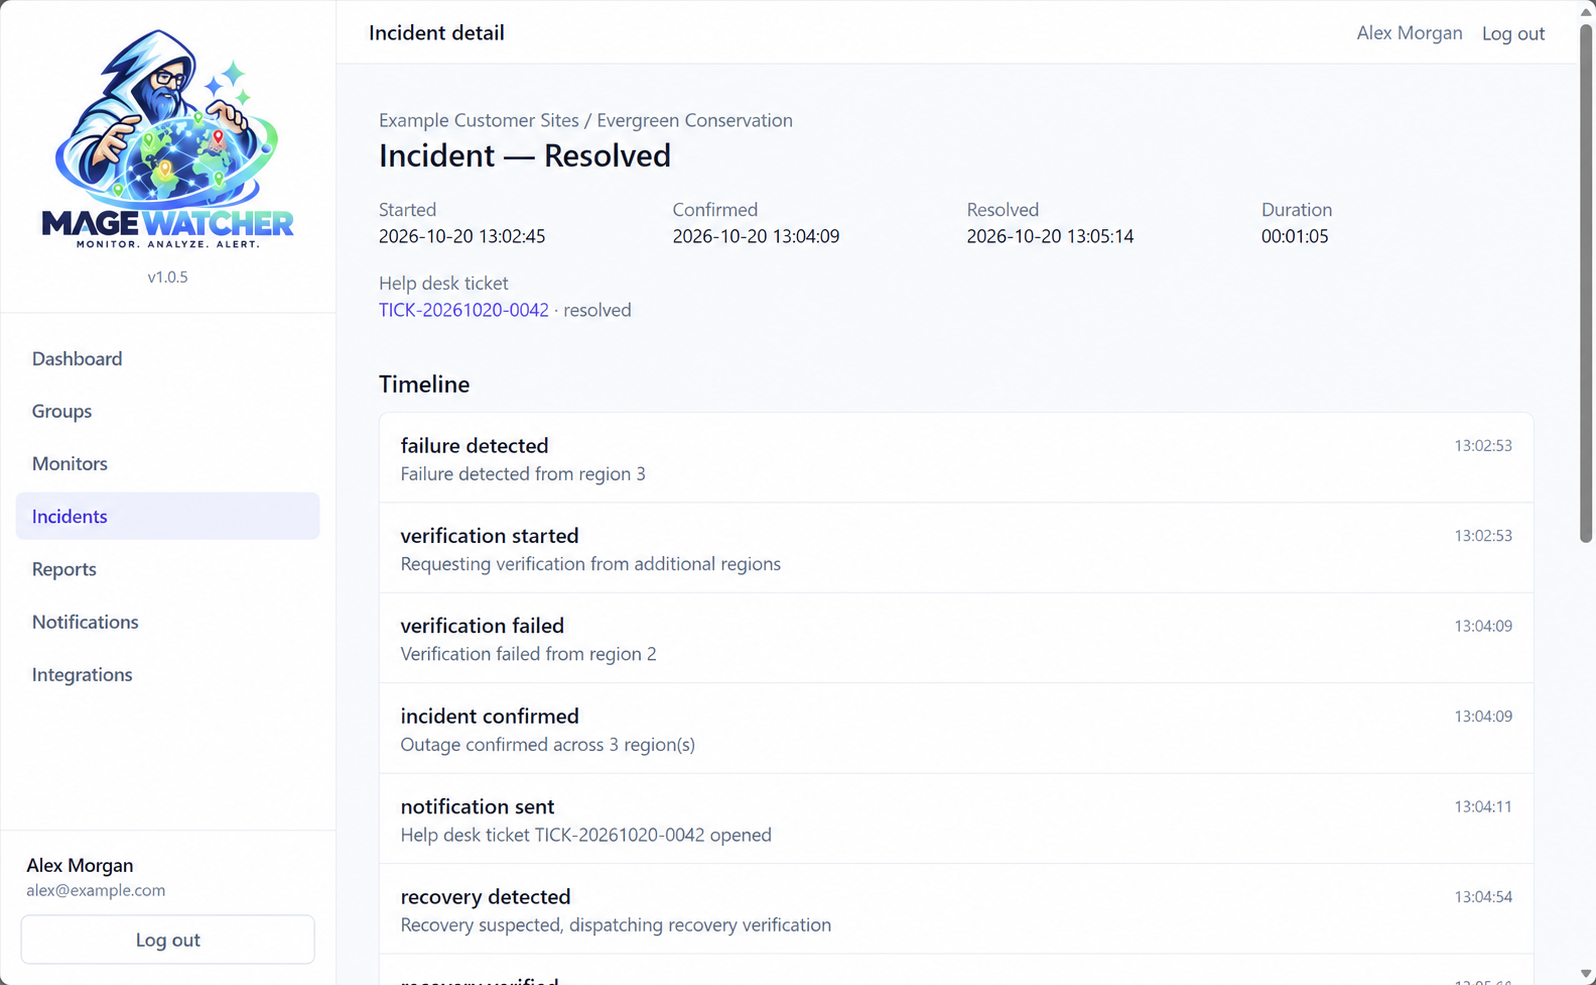
Mage Watcher asks other monitoring regions to verify a failure before it opens a confirmed incident and sends an outage email.
-
Step 01
A region spots a problem.
A failed website check starts investigation.
-
Step 02
Other regions check too.
At least two separate regions must agree before an outage is confirmed.
-
Step 03
You get a clearer signal.
Confirmed incidents trigger your configured email rules. Recovery is verified too.
If another region finds the site up, the failure is recorded as a false alarm without an outage email. Checks currently run from US regions: West, Central and Dallas. Available regions depend on your plan.
Set an alert delay of up to an hour. If the site recovers during that delay, the outage email is not sent.
Keep incident context in one place.
Review the lifecycle from investigating to resolved, regional verification, notification history and comments. Resolved incidents include outage duration.
Email the people responsible.
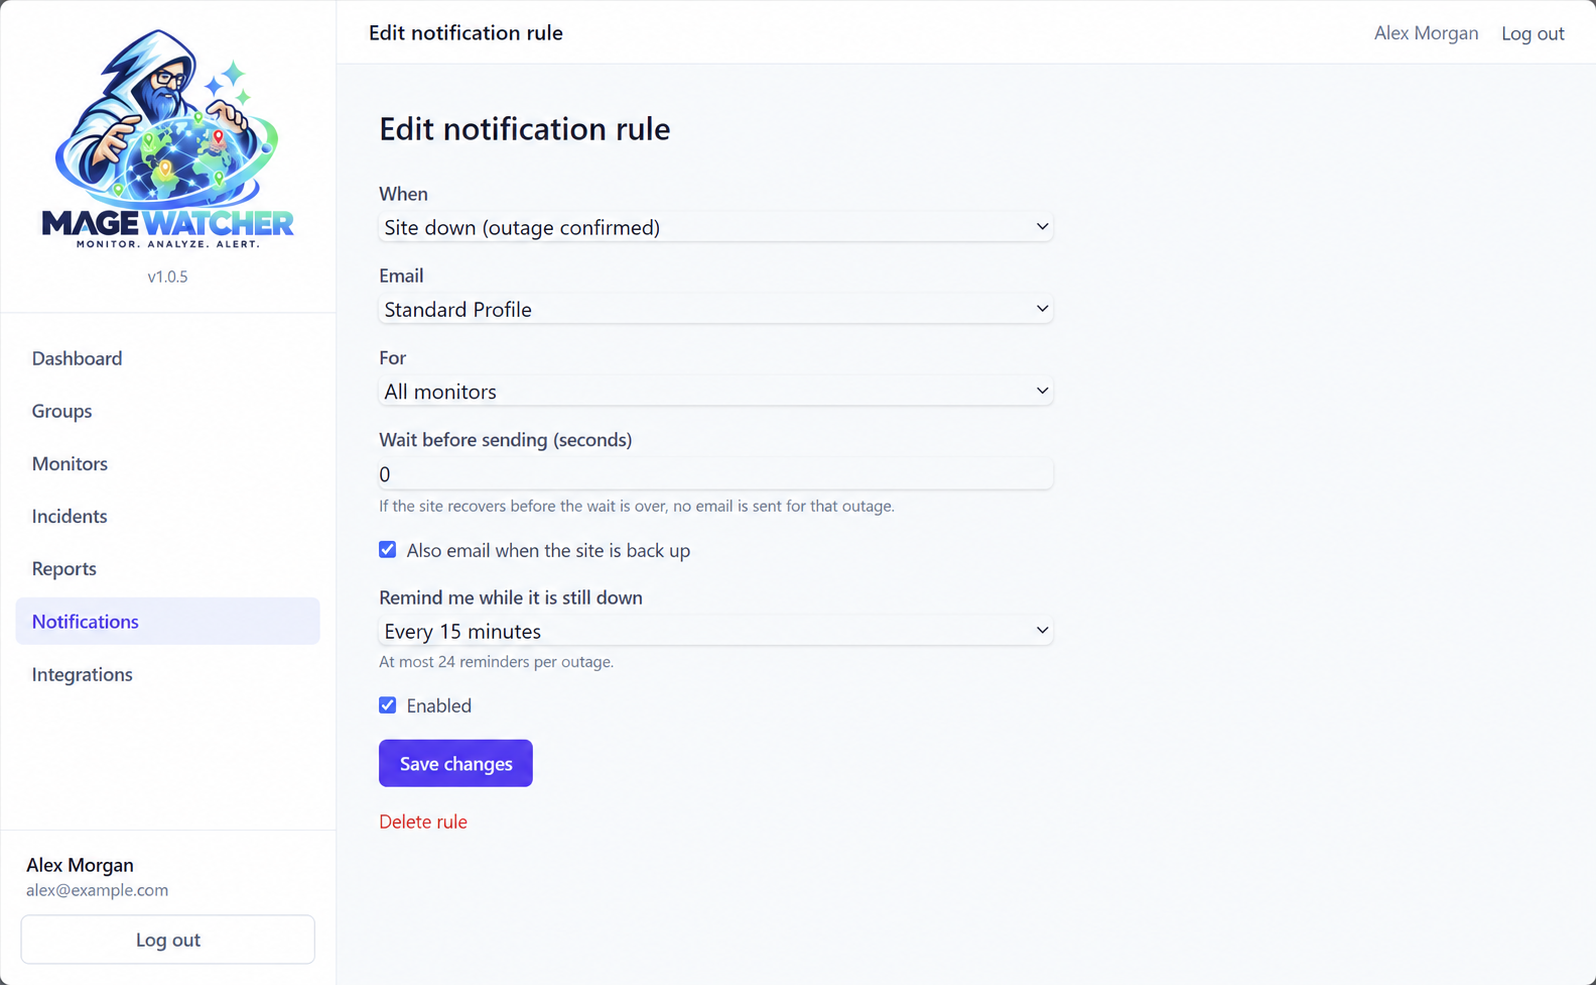
Use named channels with up to 20 email addresses each. Apply rules to all monitors, a group or an individual monitor. Optional still-down reminders repeat every 15, 30, 60, 120 or 240 minutes.
Alerts are email only.
Capture visual evidence.
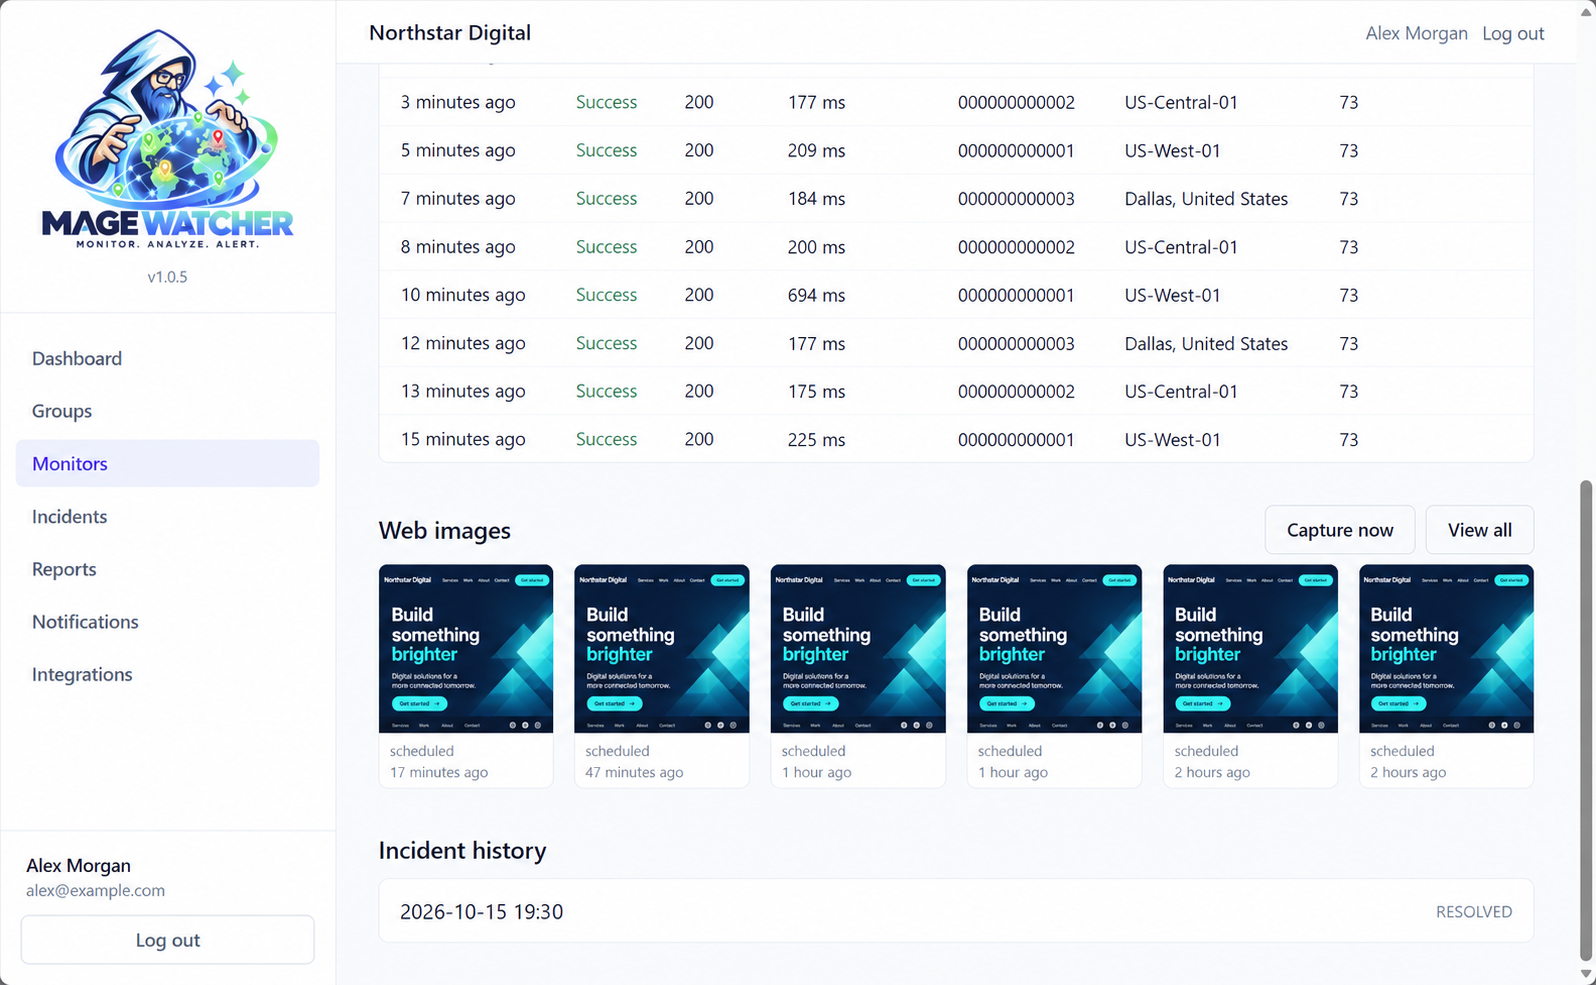
Configure Web Images for scheduled captures, failures, incidents or both. Capture on demand and review each monitor’s gallery.
Web Images requires an eligible plan or Image Capture add-on and a capture-enabled region.
Routine images default to 7-day retention, failure images to 30 days and incident evidence to 90 days; per-monitor retention can be set from 1 to 365 days.
Watch SSL certificates.
Email warnings at 30, 14, 7, 3 and 1 days before SSL expiry help you act before renewal becomes urgent.
Certificate validity is checked with each HTTPS check. Invalid or broken certificates fail the check.
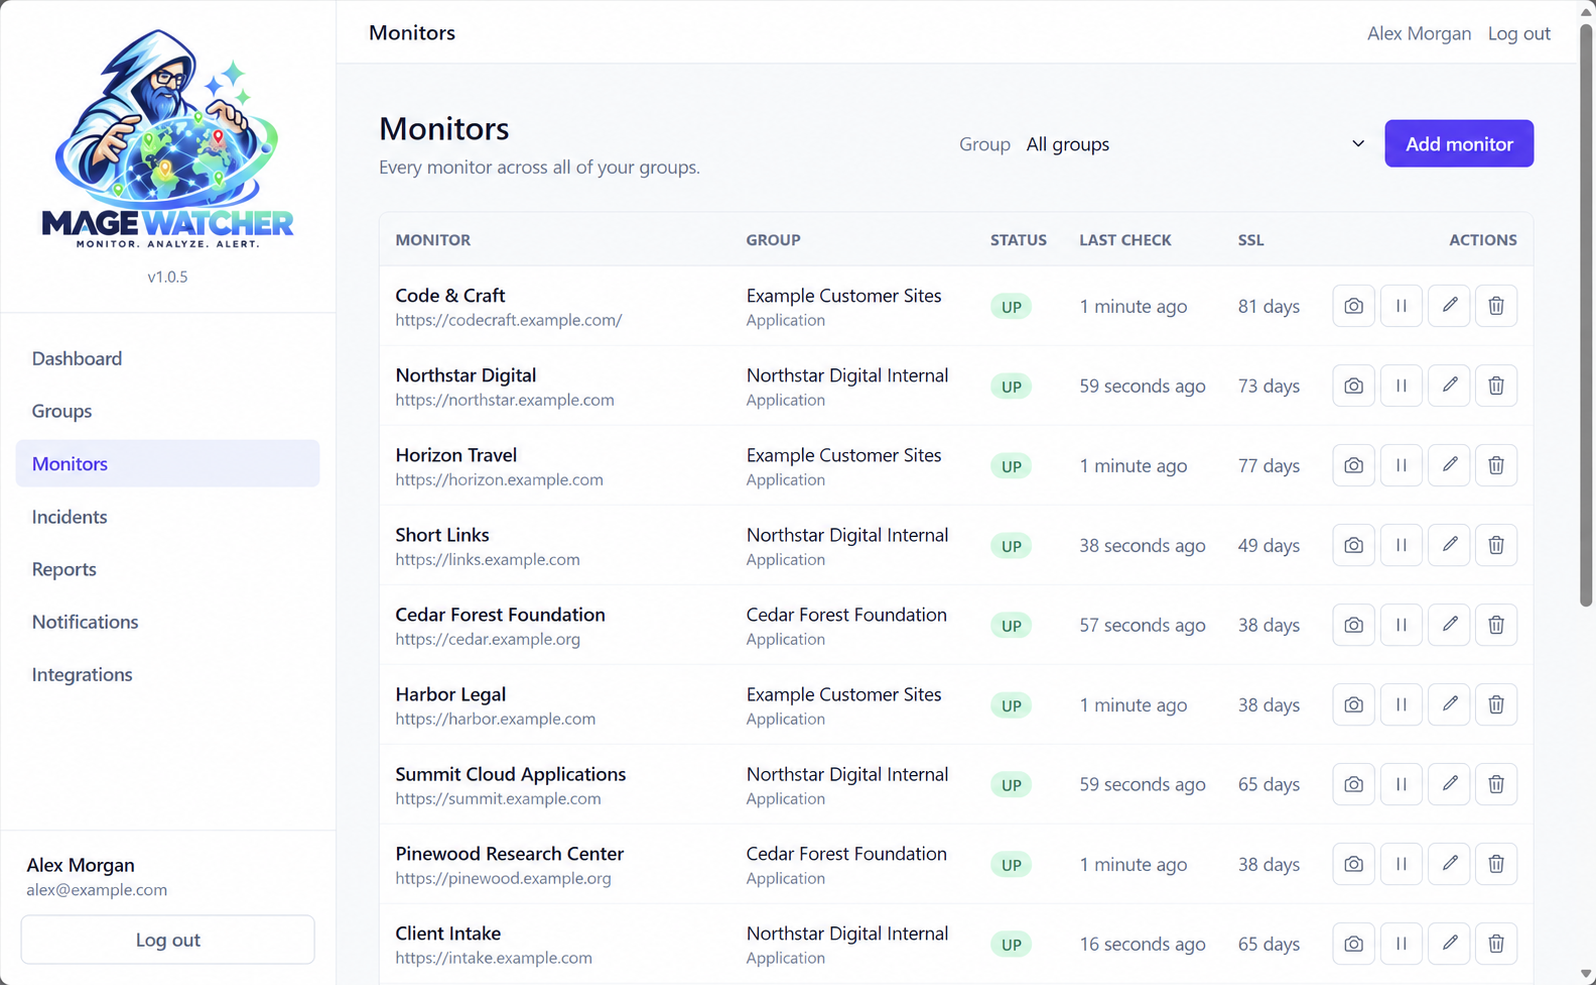
Organize around your work.
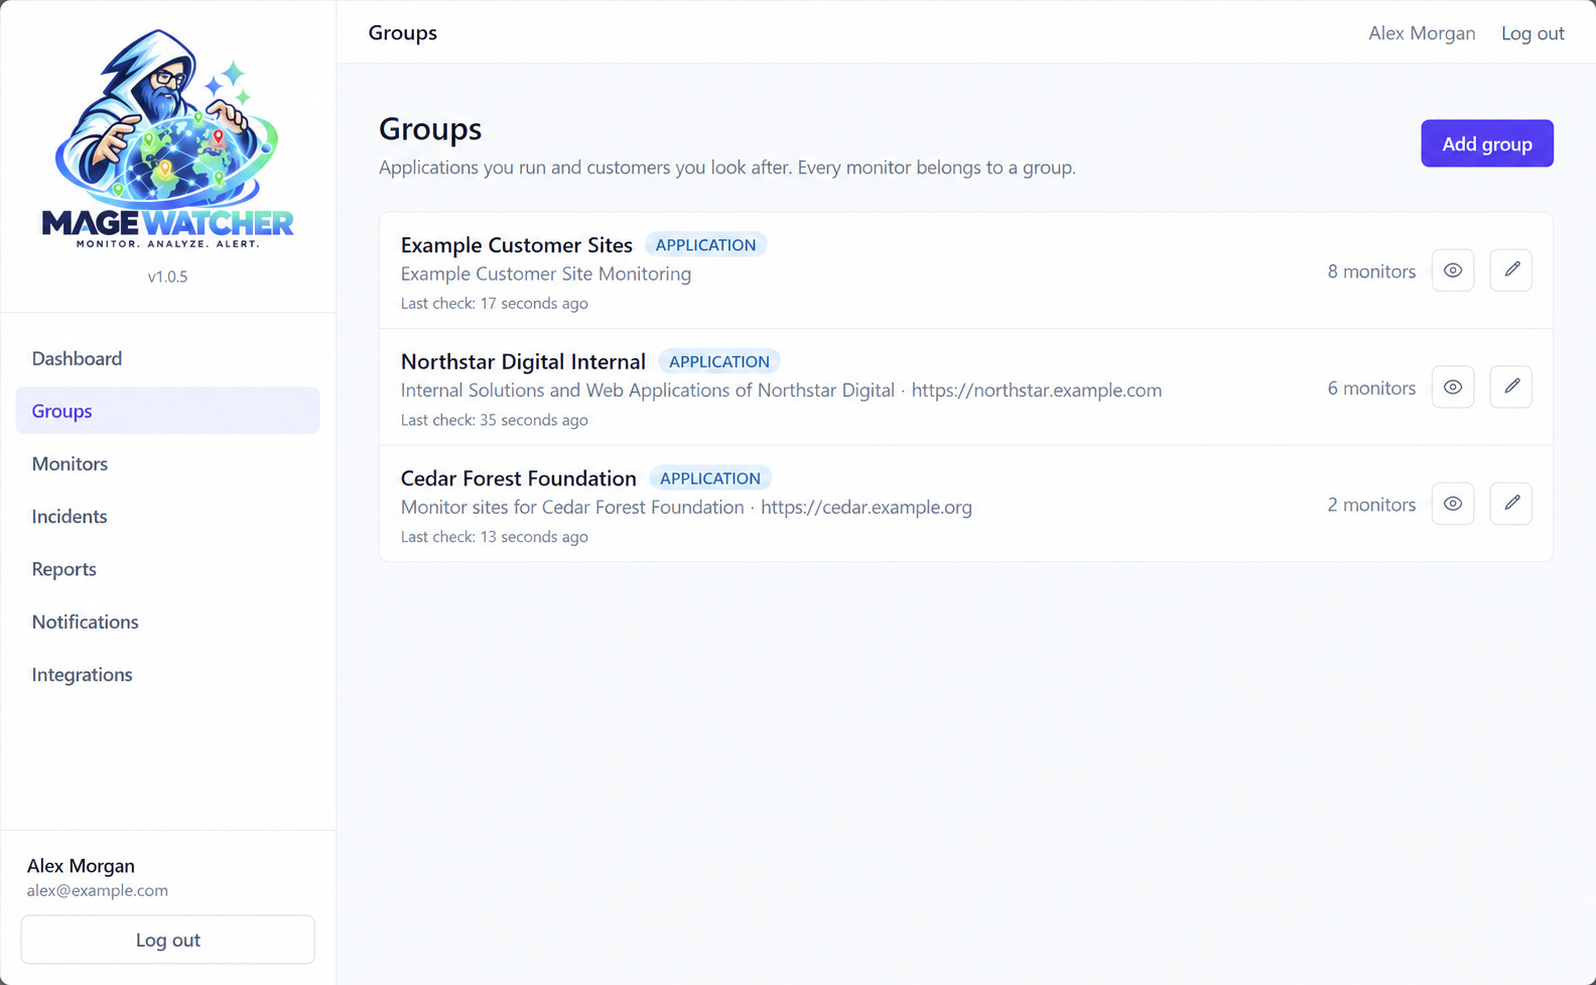
Use customer groups for client contacts and account details, or application groups for environments, owners and criticality. Filter monitors and route alerts by group.
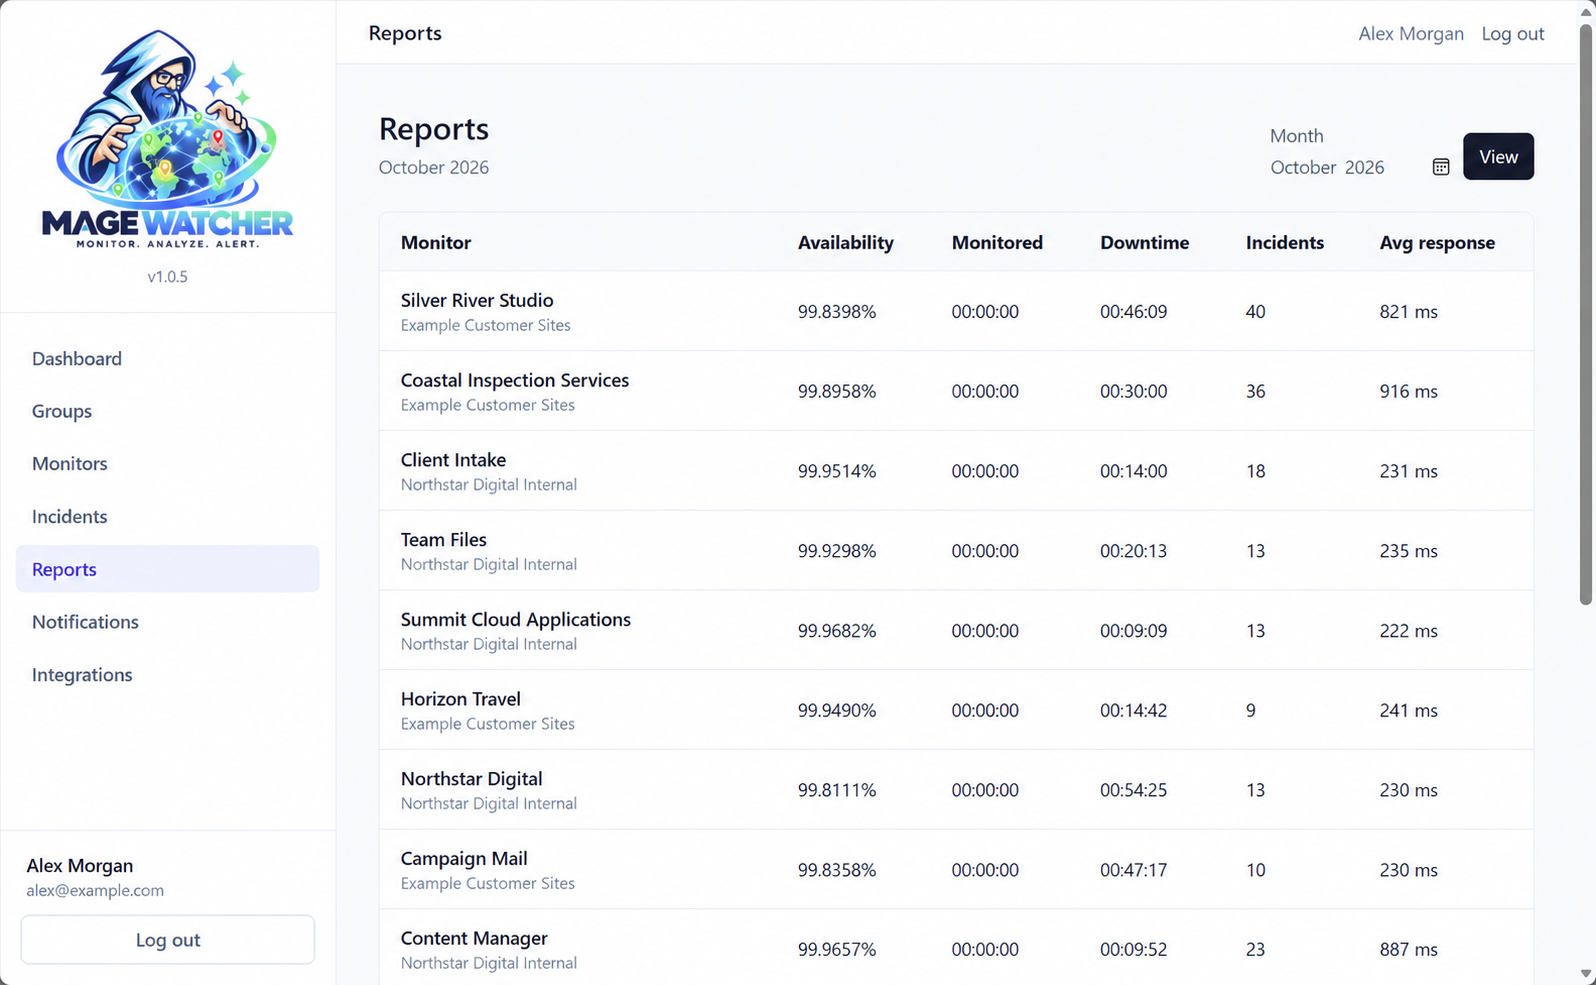
Report the month with less manual work.
See availability, monitored time, downtime, incident count and average response time by monitor. The monthly PDF arrives by email on the first of the month.
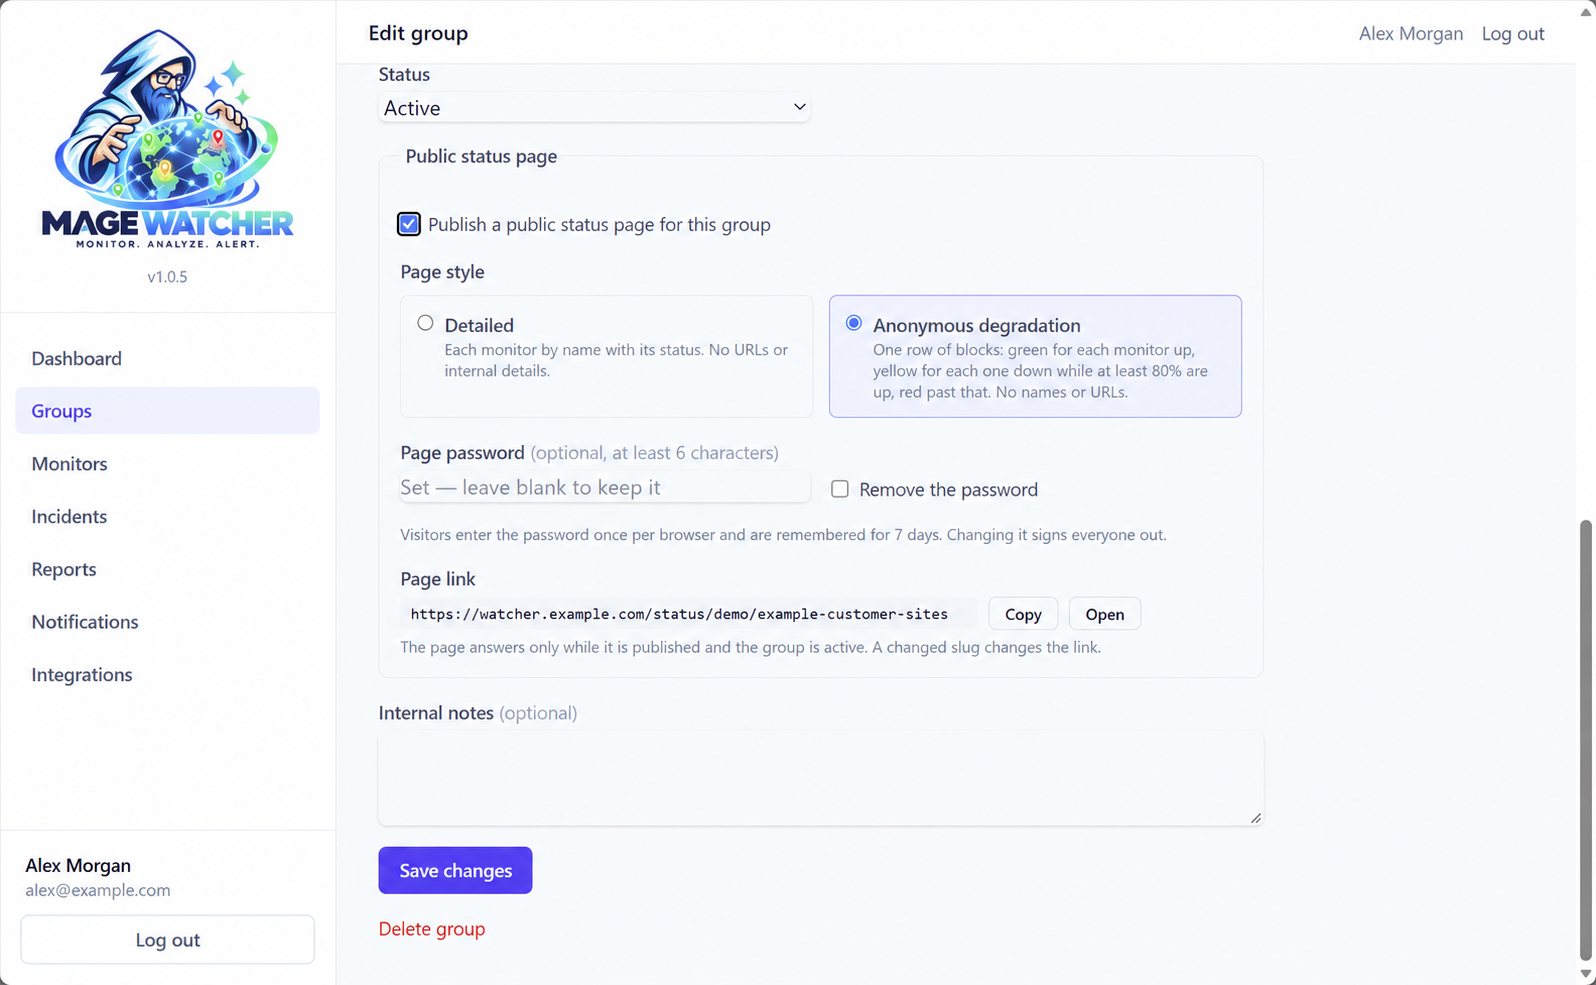
Put a clearer signal between you and your next outage.
Choose a plan through Press Mage and start watching the sites you look after.
Your workspace is provisioned through Press Mage. Billing is managed in the Press Mage portal.
Provisioned through Press Mage. Created and operated by CSP Geeks LLC.